Example · Three bakeries
Tallow Creek Bread Co.: the numbers for three bakeries
A sales dashboard for a small bakery chain: every shop's sales, its best sellers and a Monday report, with a box to ask the numbers a question in plain words.
- BusinessThree bakeries
- BuiltSales dashboard
- On its ownThe Monday report, ready by itself
Try it
Switch the range and the shop, ask a question, open a product, read the Monday report.

From the till's export to an answer
Before
Sunday night with three exports
Each shop's till export pasted into one spreadsheet, and still no answer to which shop is growing.
Now
The answer, any morning
Every shop's sales in one place, compared with last month, and a question box for the rest.
Look around
Each part of the app, as it looks with the made-up data. Open any of them live.
Every product, shop by shop
Open any product to see what it sold, day by day, in each shop, and its share of everything in its category.

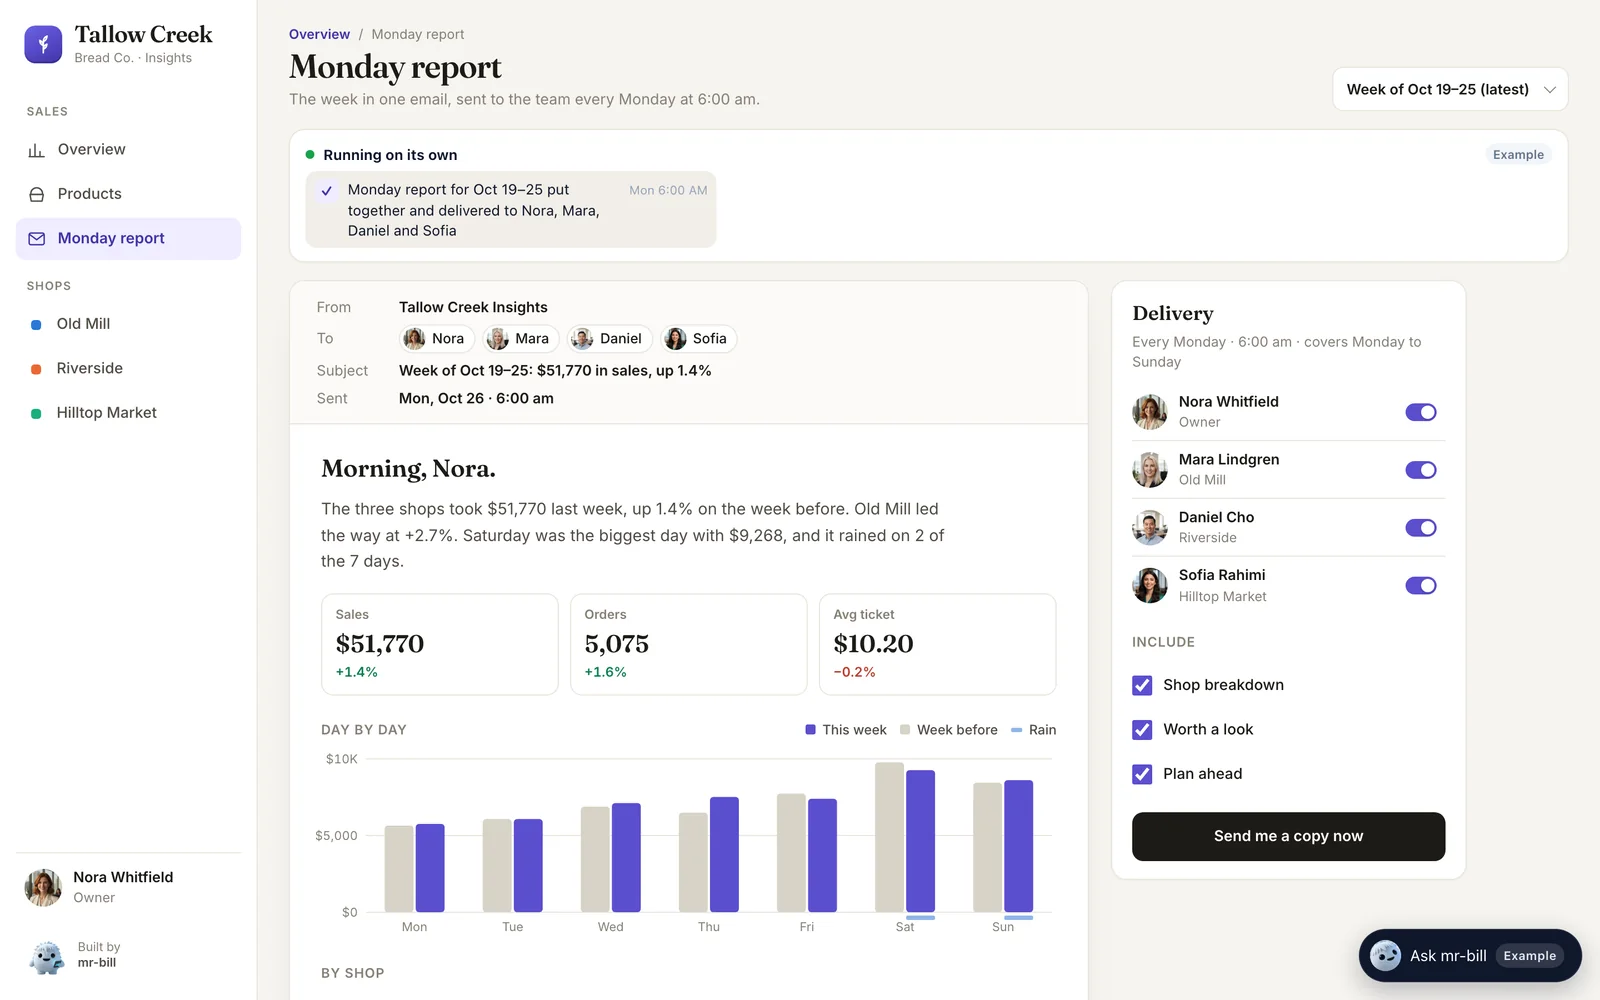
Last week, on one page
The Monday report puts last week next to the week before: sales, orders and the average ticket, every shop side by side, and the best day of each.
The numbers in your pocket
The same overview on a phone: switch the range and the shop with a thumb, between deliveries.

What it does every day
- Sales, orders and the average ticket for every shop
- Any range, compared with the one before
- Each product's sales by shop and by day
- A Monday report of last week, ready when the week starts
- Questions in plain words, answered from the real numbers